Construction Activity in the Food & Drink Manufacturing & Processing Industry Report – UK 2015-2019
Available as an Instant Download PDF
he 2nd edition of this report specifically reviews the Food and Drink Manufacturing and Processing (FDMP) Construction Market in the UK. This report also reviews the main challenges facing the FDMP sector including rising costs of labour and supply materials; continued downward pressure on sale values by both retailers and consumers; the drive towards value products; the impact of the impending EU Referendum; the Russian ban on food imports; the rise of the functional foods market; the increasing trend towards lower alcohol products, gluten-free products and reducing the fat and salt content in foods. Detailed market data and insight on the food and drink manufacturing & processing market by Barbour ABI, a leading UK provider of construction market intelligence.
£795.00 Exc. VAT
Barbour ABI have published the 2nd edition of the report ‘Construction Activity in the Food & Drink Manufacturing & Processing Industry Report – UK 2015-2019’. This report incorporates original input and primary research, and represents an up-to-date and perceptive review of the market and its development. It should be of particular interest to construction companies, their supply chains operating in the UK food manufacturing, processing and retail sectors, and suppliers of food processing equipment and allied products.
Key areas covered:
- Construction output in the Food & Drink Manufacturing and Processing (FDMP) sector, capital expenditure and capital projects.
- Construction issues in the design of food manufacturing and cold storage facilities including legislation, regulatory requirements, hygiene issues, construction materials, waste & recycling issues.
- Key issues – refurbishment and extension of current facilities, improving production capacity and efficiency through initiatives such as automation and temporary processing, etc.
- Review of major players – contractors, consultants, architects and product suppliers involved in the FDMP sector.
- Introduction to the Food & Drink Manufacturing & Processing sectors – market size, value, key players etc. Overview of main food & drink manufacturing, distribution and R&D facilities in the UK.
Key areas of insight include:
- Analysis of Capital Expenditure levels in the FDMP market. Growing demand in the dairy, beverage and meat and ready meals sectors has driven capacity expansion, reflected in the level of projects recently completed or under development.
- In terms of food processing facility construction, upgrading and fit-out work accounts for around 80% of total output in the sector – this is being driven by manufacturers consolidating, improving and maintaining facilities at existing sites.
- Construction Issues in the FDMP sector – Construction Materials; Food Premises Design and Construction; Legislation; Guidelines, Standards; Waste & Recycling.
- Analysis of activity, key companies and value of key sub-sectors within the FDMP sector – Meat & Fish, Fruit & Vegetables, Dairy, Milling, Bakery, Confectionery and Soft Drinks.
- Detailed analysis of regional food production clusters. Key areas of manufacturing in the UK.
- Forecast of market performance to 2019.
- Detailed market data and insight on the food and drink manufacturing & processing market by Barbour ABI, a leading UK provider of construction market intelligence.
Some of the companies included:
2 Sisters Food Group, A&H Construction, Arla Foods, Associated British Foods, ATB Cold Projects, Barr Ltd, Britvic, Caddick Construction, Celsius Projects, Chalcroft Construction, Coca Cola Enterprises, Clegg Food Projects, Dairy Crest, FJB Systems, Glanbia Premier Foods, Hilton Food Group, Integrated Food Projects, Irish Dairy Board (Ornua), KDH Projects, Kerry Group, Lindum Group, Lorien Engineering, Moy Park, Nestle, Northern Foods, Olympia Projects, PM Group, PPS, Princes, SBH Ltd, Sisk, Tate & Lyle, Taylor Rose, The Austin Company, Tulip, Unilever, United Biscuits, Wates and Willett Food Projects.
Construction Activity in the FDMP Sector
- Current and forecast construction output in the FDMP sector. Overall construction output, output by sector and construction trends. Forecasts through to 2019, market size by value with trends.
- Capital expenditure and capital construction projects in the UK FDMP Sector.
- Construction issues in the FDMP sector – Construction Materials; Contamination & Hygiene Issues; Food Premises Design & Construction; Legislation, Guidelines & Standards for Food Processing Premises; Waste & Recycling in the Food Processing Industry.
Construction Capability & Supply in the FDMP Sector
- Construction contractors and consultants with presence in the FDMP sector.
- Food premises design and construction – hygiene and construction issues, design issues.
- Specialist Food Processing Construction, Supply and Services – Equipment & Packaging, Refrigeration & Cold Storage.
- Construction issues in the design of food manufacturing and cold storage facilities including legislation, regulatory requirements, hygiene issues, and construction materials such as frozen and chilled warehousing, sandwich panels, modular panels etc.
- Waste and recycling in the FDMP industry.
FDMP Sector – Market Size and Overview
- Market definition, size and value including market trends and key influences.
- UK trade in the FDMP sector – Imports and exports for 2014.
- Analysis of activity, key companies and value of key sub-sectors within the FDMP sector – Meat & Fish, Fruit & Vegetables, Dairy, Milling, Bakery, Confectionery and Soft Drinks.
- Regional concentration and key areas of food manufacturing – Northwest, Yorkshire & Humber, East & West Midlands, East of England, Scotland, Northern Ireland.
- Food Research & Development in the UK – Key trends and key research organisations & institutes in the UK FDMP Sector.
- Market drivers and key issues in the food manufacturing industry – Retailer influence, drive towards value lines, functional foods market, corporation tax, raw materials & commodity prices, impact of the 2015 General Election.
Leading Companies in the FDMP Sector
- Food & Drink company league tables in the UK including key financial information for leading manufacturers.
- Merger & acquisition activity in the UK food manufacturing market.
- Company Profiles: 2 Sisters Food Group, Arla Foods, Associated British Foods, Britvic, Coca Cola Enterprises, Dairy Crest, Glanbia, Irish Dairy Board (Ornua), Kerry Group, Nestle UK, Premier Foods, Tate & Lyle, Tulip Foods, Unilever.
- Other company profiles – Retailers, Chilled Foods, Soft Drinks.
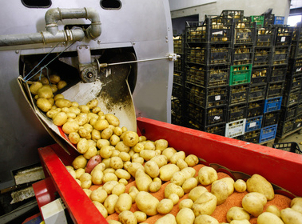
The food and drink manufacturing and processing industry (FDMP) is the single largest manufacturing sector in the UK, employing around 400,000 workers. The food processing industry has performed better than the wider manufacturing sector. Growth is forecast at between 3-4% in the short to medium term, and the sector is expected to reach an approximate value of £113.1bn in 2018-19.
Over 8,000 companies are active in the FDMP sector across the UK, with over 85% of enterprises qualifying as small (fewer than 50 employees). However, the top 5 UK food companies account for over £30bn in terms of turnover, with the top 20 food producers operating over 300 manufacturing and distribution sites across the UK.
There are over 9,500 manufacturing sites and factories in the UK FDMP sector, with the bakery, meat processing and dairy industry operating the largest number of processing sites. FDMP activity varies across the UK, with Scotland, the North West and Yorkshire and Humber having the highest concentration of food processing activity. Over the last couple of years, the FDMP sector has seen increased capital investment levels, reflecting the growing optimism in the wider economy.
The industry is characterised by an ageing stock of manufacturing facilities and equipment and new projects are mainly focused on upgrading existing assets to achieve greater efficiencies, leading to higher outputs and lower costs. Upgrading and fit-out work therefore accounts for around 80% of total output in the sector. Going forward construction output in the food processing sector is likely to remain relatively buoyant, mainly driven by RMI activity. As a result, we are forecasting growth rates in construction output of between 3-5% over the next few years to reach a total of around £475m by 2019.
- Contents Listing
- 1. INTRODUCTION 7
- 2. SUMMARY AND FUTURE PROSPECTS 8
- 3. ECONOMIC ENVIRONMENT 12
- 3.1 GDP 12
- 3.2 INFLATION & INTEREST RATES 13
- 3.3 UNEMPLOYMENT 14
- 3.4 HOUSEHOLD CONSUMPTION 15
- 3.5 HOUSING & CONSTRUCTION 15
- 3.6 STERLING 17
- 3.7 POPULATION PROFILE 18
- 3.8 CONCLUSIONS 18
- 4. CONSTRUCTION ACTIVITY IN THE FDMP INDUSTRY 20
- 4.1 NON-DOMESTIC CONSTRUCTION OUTPUT 20
- 4.2 CONSTRUCTION OUTPUT IN THE FDMP SECTOR 21
- 4.2.1 Market Size and Trends to 2019 21
- 4.3 CAPITAL EXPENDITURE IN THE FDMP SECTOR 23
- 4.4 CAPITAL PROJECTS IN THE FDMP SECTOR 27
- 5. CONSTRUCTION CAPABILITY AND SUPPLY IN THE FDMP MARKET 29
- 5.1 CONSTRUCTION CONSULTANTS & CONTRACTORS IN THE FDMP INDUSTRY 29
- 5.2 FOOD PREMISES DESIGN & CONSTRUCTION 36
- 5.2.1 Hygiene and Construction Issues 37
- 5.2.2 Design Issues 38
- 5.3 EQUIPMENT AND PACKAGING SERVICES – FOOD PROCESSING & MANUFACTURING 38
- 5.4 REFRIGERATED & COLD STORAGE CONTRACTORS & SUPPLIERS 40
- 5.5 CONSTRUCTION PRODUCTS IN THE FDMP SECTOR 41
- 5.5.1 Sandwich Panels 41
- 5.5.2 Cold Storage – Frozen & Chilled Warehousing 42
- 5.5.3 Modular Panels 42
- 5.5.4 Ceilings and Floors 43
- 5.6 WASTE AND RECYCLING IN THE FDMP INDUSTRY 43
- 6. FOOD & DRINK MANUFACTURING AND PROCESSING MARKET 45
- 6.1 MARKET OVERVIEW 45
- 6.2 MARKET SIZE BY VALUE 2008-2015 45
- 6.3 IMPORTS AND EXPORTS 47
- 6.4 MARKET DRIVERS AND KEY ISSUES IN THE FOOD PROCESSING INDUSTRY 48
- 6.4.1 Retailers 48
- 6.4.2 Drive towards Value Lines 49
- 6.4.3 Functional Foods 49
- 6.4.4 Corporation Tax 51
- 6.4.5 2015 General Election 51
- 6.4.6 Other Issues affecting the Food Industry 52
- 6.5 SECTOR ANALYSIS 53
- 6.5.1 Meat & Fish Processing 55
- 6.5.2 Fruit & Vegetables 56
- 6.5.3 Dairy 56
- 6.5.4 Grain Milling 57
- 6.5.5 Bakery Products 57
- 6.5.6 Confectionery Products 58
- 6.5.7 Soft Drinks 58
- 6.5.8 Manufacturing Turnover by Sector 58
- 6.6 FOOD MANUFACTURING SITES 60
- 6.6.1 Regional Concentration of Food Manufacturing 62
- 6.7 FOOD RESEARCH AND DEVELOPMENT IN THE UK 66
- 7. LEADING FOOD & DRINK MANUFACTURING COMPANIES IN THE UK 68
- 7.1 FOOD & DRINK MANUFACTURERS 68
- 7.1.1 Top UK Food & Drink Manufacturers Overview 68
- 7.1.2 Mergers & Acquisitions 69
- 7.2 COMPANY PROFILES 70
- 7.2.1 2 Sisters Food Group 70
- 7.2.2 Arla Foods 71
- 7.2.3 Associated British Foods (ABF) 72
- 7.2.4 Britvic 72
- 7.2.5 Coca Cola Enterprises (CCE) 72
- 7.2.6 Dairy Crest 73
- 7.2.7 Glanbia 73
- 7.2.8 Irish Dairy Board (Ornua) 74
- 7.2.9 Kerry Group 74
- 7.2.10 Nestle UK 75
- 7.2.11 Premier Foods 75
- 7.2.12 Tate & Lyle 76
- 7.2.13 Tulip Foods 76
- 7.2.14 Unilever 77
- 7.3 OTHER FOOD MANUFACTURING COMPANIES 77
- 7.4 OTHER BEVERAGE MANUFACTURING COMPANIES 79
- APPENDICIES 80
- Tables & Charts
- CHART 1 TURNOVER OF THE UK FOOD PROCESSING INDUSTRY (£BN) – 2009-2019 8
- TABLE 2 GDP DATA – 2012-2015 – KEY CONSTITUENT ELEMENTS 12
- CHART 3 INTEREST RATES AND INFLATION (CPI) FROM 2000-2019 14
- CHART 4 PDI & SAVINGS RATIO AT CURRENT PRICES 2000-2019 15
- TABLE 5 EXCHANGE RATE FLUCTUATIONS 2009-2015 – STERLING TO THE DOLLAR, AND THE EURO, SPOT RATES 17
- CHART 6 VALUE OF NON-DOMESTIC CONSTRUCTION OUTPUT 2009 – 2019 BY VALUE (£BN AT CURRENT PRICES) 20
- CHART 7 NON-RESIDENTIAL CONSTRUCTION OUTPUT ANALYSIS BY SECTOR 2014 – % BY VALUE 21
- CHART 8 ESTIMATED VALUE OF CONSTRUCTION OUTPUT IN THE FOOD & DRINK MANUFACTURING & PROCESSING INDUSTRY 2009 – 2019 BY VALUE (£BN AT CURRENT PRICES) 22
- CHART 9 UK FOOD & DRINK MANUFACTURING & PROCESSING INDUSTRY CAPITAL EXPENDITURE (£BN)- 2008-2019 24
- TABLE 10 TOP FOOD & DRINK MANUFACTURING COMPANIES BY CAPEX SPEND IN 2013-14 (£M)* 25
- CHART 11 TURNOVER OF THE UK FOOD & DRINK MANUFACTURING MARKET (£BN) – 2008-2015 45
- TABLE 12 UK EXPORTS OF FOOD & NON-ALCOHOLIC DRINKS BY SECTOR 2013-2014 (£BN) 47
- CHART 13 VALUE OF FOOD AND DRINK MANUFACTURING BY PRODUCT SECTOR 2013-14 (%) 54
- TABLE 14 MANUFACTURE OF FOOD & BEVERAGE PRODUCTS 2013-14 (BY. NO. FIRMS, TURNOVER AND EMPLOYMENT) 55
- CHART 15 UK MANUFACTURING TURNOVER BY SECTOR 2012-13 & 2013-14 (£M) 59
- TABLE 16 UK FDMP SECTOR – MAJOR COMPANIES AND GEOGRAPHICAL LOCATION OF FACILITIES (UK) 61
- CHART 17 UK REGIONAL MIX OF FOOD AND DRINK MANUFACTURING (%) 2013-14 62
- CHART 18 MANUFACTURE OF FOOD AND DRINK PRODUCTS IN ENGLAND BY REGION 2013-14 (%) 63
- TABLE 19 TOP FOOD & DRINK MANUFACTURING COMPANIES BY UK R&D SPEND IN 2013-14 (£M)* 67
- TABLE 20 TOP UK FOOD COMPANIES BY TURNOVER (£BN) 2014 69
- TABLE 21 DISTRIBUTION OF DAIRY AND MILK PROCESSING PLANTS IN THE UK (BY REGION) 81
- TABLE 22 DISTRIBUTION OF FOOD MANUFACTURING COMPANIES IN SCOTLAND (NO. AND TYPE OF COMPANIES) 82
- TABLE 23 TOP 10 FOOD MANUFACTURERS IN NORTHERN IRELAND BY ACTIVITY AND TURNOVER (£M) 83
- TABLE 24 OTHER TOP FOOD MANUFACTURING COMPANIES* – KEY OPERATING & FINANCIAL SUMMARY DATA 84

Paired Report Discount
Save £250 for every two reports you buy
Discount applied in basket
Frequently bought together

Trusted by industry leaders
For more detailed requests speak to our research experts directly
By using this form you agree that your data will be processed and protected in line with our Privacy Policy.
Research you can depend on
Our reports go deeper to give you the insights needed to make your next strategic move.
- Detailed assessment of the market – analysis of the market structure and recent developments within the market.
- Market prospects up to 4 years – market value, opportunities, impact of Covid-19, Brexit etc.
- Detailed information – market size, influences, market factors and key players.
- Analysis by product group – market size, product mix, sector trends etc.